BrüMate recently completed a Meta conversions API channel lift study with the help of our partners in the disrupters program at Meta and I thought it would be cool to share how we executed the test from the brand side. The premise of the test was that we would use the Meta conversions API to send data from other attribution tools (in this case Google Analytics) so that we would have a better understanding of Meta’s contribution to our performance. For a long time, I’ve wanted to answer the question of where the discrepancy between platform attributed conversion and GA reported orders came from. In almost all cases Meta’s pixel was tracking significantly more orders attributed to our campaigns that were tracked in GA. Our baseline assumptions on the brand side was that Meta had a touchpoint with more customers than actually purchased through a direct click, but we weren’t sure how these customers were ultimately converting.
The Output
The Meta team put together a great case study for us on the ultimate results of the CAPI channel lift study which you can find here:
https://www.facebook.com/business/success/brumate
Although the study outlines the great results we were able to get and how they impacted our thinking about budget allocation in Meta, it doesn’t give much visibility into how you might execute a test like this yourself (or with the help of your agency or Meta team).
Here is what the completed setup looks like in the Meta reporting platform:
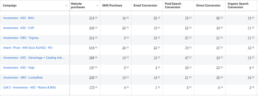
The website purchases on the far left are the purchases that Meta has attributed to the ad via the pixel. The columns to the right indicate orders that Meta credited to the pixel but were credited to a different channel in Google Analytics. Ultimately, we used this data to better our understanding of where customers who were exposed to our paid social ads were ultimately converting.
The Setup
To capture the data required to solve this problem we had to make a simple data connection, send GA attribution data back to Meta so that they could view both sides of the equation. It sounds simple in practice, but the implementation was quite a bit more complex because GA doesn’t have data available till 24 hours or more after the order is completed. With a traditional Meta conversions API implementation, the API receives data as soon as the order is completed, but in this case, we had to stitch data together after GA had processed it the next day and then send the data to Meta.
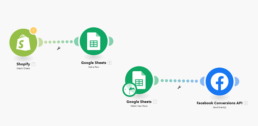
In order to overcome this we came up with a solution where we would bring all of the data required to send conversions API events into a Google Sheet where we could combine the data we needed from GA and the data from our ecommerce platform (Shopify) to send all the correct data for attribution back to Meta. From GA we would provide the order timestamp, channel attribution, revenue value, and Facebook parameters. From Shopify we brought in other PII data that cannot be stored in GA like customer name, email, phone, browser IP, and zip code. Using the order ID as a key we married up the data from GA and Shopify into a payload that would provide Facebook everything they needed to properly credit the conversions back to individual ads. We then used a tool called make.com to send this data to Meta automatically.
The one part of this that is slightly different from a standard GA setup is the need to capture the Facebook parameters in GA as a custom dimension so they could be included in the CAPI events. We accomplished this by using Google Tag Manager to map a custom dimension that contained the values of Meta parameters that were stored in browser cookies. The cookies are easily accessible and store critical data for tying back performance to an ad. Using GTM you can use the cookie variable to pickup the value and send it as a custom dimension to GA which you can pull out in reporting later. You can also use this parameter in GA to build custom reports which will show you users who have been exposed to Meta advertising regardless of session source.
To build the Google Sheet which contained the required data we first brought in data using a sheets add-on called GA4 Magic Reports. I highly recommend this as a free way to bring GA4 data into Google Sheets on a schedule.
https://workspace.google.com/u/0/marketplace/app/ga4_magic_reports/6532356327
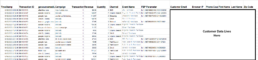
We then used make.com to pipe the order level data from Shopify into the Google Sheet and used lookups against the order ID to match the data together. Ultimately, we ended up with a Google Sheet that looked like this:
Using make.com we then passed the data from the Google Sheet to Facebook Conversions API using their built-in integration. The overall setup was quite simple and cost effective. Our flow in Make used some simple copies from Shopify to the sheet and then from the sheet to Meta.
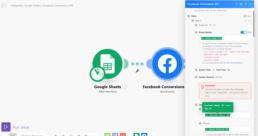
The make.com integration allows you to quickly and easily map fields from your Google Sheet into the required parameters for CAPI.
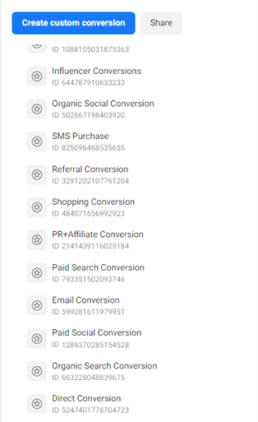
Lastly, within the Meta businsiness manager we mapped custom conversions for each of the channels we were sending data for so that we could measure their performance against our ads. Each of the channels that you wish to measure has a different event name being sent to CAPI and need a separate custom conversion setup to capture the data within ads manager. Once they are setup you will be able to see the columns available under the custom conversions columns.
If you’re interested in capturing this type of data reach out to your Meta account team, your agency, or drop me a line at andrew@amjone.co and I’d be happy to help you get it setup. The Meta Conversions API Channel Lift Study Setup will help you get a better understanding of how your marketing ecosystem works! If you want to checkout tracking for new vs repeat customers within the pixel as well checkout my article here: https://amjones.co/meta-pixel-new-vs-repeat/