Taking a Multi Model Approach to Media Mix Modeling
Why One Model Isn’t Always Enough
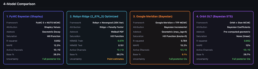
The Single-Model Problem
What Went Wrong with Robyn
The Core Insight
Meta Conversions API Channel Lift Study Setup
BrüMate recently completed a Meta conversions API channel lift study with the help of our partners in the disrupters program at Meta and I thought it would be cool to share how we executed the test from the brand side. The premise of the test was that we would use the Meta conversions API to send data from other attribution tools (in this case Google Analytics) so that we would have a better understanding of Meta’s contribution to our performance. For a long time, I’ve wanted to answer the question of where the discrepancy between platform attributed conversion and GA reported orders came from. In almost all cases Meta’s pixel was tracking significantly more orders attributed to our campaigns that were tracked in GA. Our baseline assumptions on the brand side was that Meta had a touchpoint with more customers than actually purchased through a direct click, but we weren’t sure how these customers were ultimately converting.
The Output
The Meta team put together a great case study for us on the ultimate results of the CAPI channel lift study which you can find here:
https://www.facebook.com/business/success/brumate
Although the study outlines the great results we were able to get and how they impacted our thinking about budget allocation in Meta, it doesn’t give much visibility into how you might execute a test like this yourself (or with the help of your agency or Meta team).
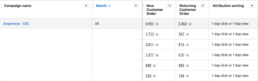
Here is what the completed setup looks like in the Meta reporting platform:
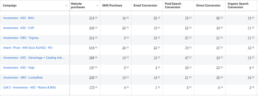
The website purchases on the far left are the purchases that Meta has attributed to the ad via the pixel. The columns to the right indicate orders that Meta credited to the pixel but were credited to a different channel in Google Analytics. Ultimately, we used this data to better our understanding of where customers who were exposed to our paid social ads were ultimately converting.
The Setup
To capture the data required to solve this problem we had to make a simple data connection, send GA attribution data back to Meta so that they could view both sides of the equation. It sounds simple in practice, but the implementation was quite a bit more complex because GA doesn’t have data available till 24 hours or more after the order is completed. With a traditional Meta conversions API implementation, the API receives data as soon as the order is completed, but in this case, we had to stitch data together after GA had processed it the next day and then send the data to Meta.
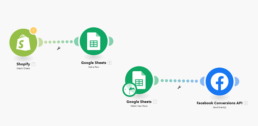
In order to overcome this we came up with a solution where we would bring all of the data required to send conversions API events into a Google Sheet where we could combine the data we needed from GA and the data from our ecommerce platform (Shopify) to send all the correct data for attribution back to Meta. From GA we would provide the order timestamp, channel attribution, revenue value, and Facebook parameters. From Shopify we brought in other PII data that cannot be stored in GA like customer name, email, phone, browser IP, and zip code. Using the order ID as a key we married up the data from GA and Shopify into a payload that would provide Facebook everything they needed to properly credit the conversions back to individual ads. We then used a tool called make.com to send this data to Meta automatically.
The one part of this that is slightly different from a standard GA setup is the need to capture the Facebook parameters in GA as a custom dimension so they could be included in the CAPI events. We accomplished this by using Google Tag Manager to map a custom dimension that contained the values of Meta parameters that were stored in browser cookies. The cookies are easily accessible and store critical data for tying back performance to an ad. Using GTM you can use the cookie variable to pickup the value and send it as a custom dimension to GA which you can pull out in reporting later. You can also use this parameter in GA to build custom reports which will show you users who have been exposed to Meta advertising regardless of session source.
To build the Google Sheet which contained the required data we first brought in data using a sheets add-on called GA4 Magic Reports. I highly recommend this as a free way to bring GA4 data into Google Sheets on a schedule.
https://workspace.google.com/u/0/marketplace/app/ga4_magic_reports/6532356327
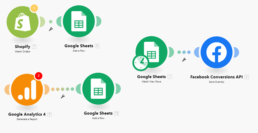
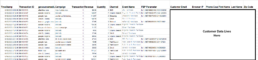
We then used make.com to pipe the order level data from Shopify into the Google Sheet and used lookups against the order ID to match the data together. Ultimately, we ended up with a Google Sheet that looked like this:
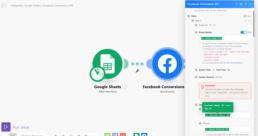
Using make.com we then passed the data from the Google Sheet to Facebook Conversions API using their built-in integration. The overall setup was quite simple and cost effective. Our flow in Make used some simple copies from Shopify to the sheet and then from the sheet to Meta.
The make.com integration allows you to quickly and easily map fields from your Google Sheet into the required parameters for CAPI.
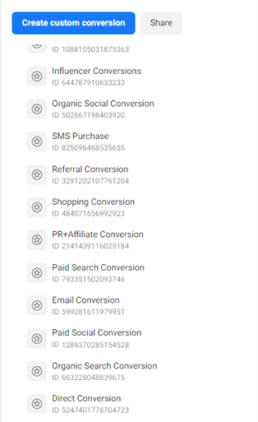
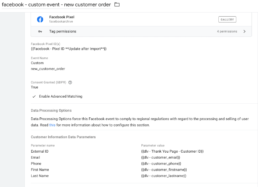
Lastly, within the Meta businsiness manager we mapped custom conversions for each of the channels we were sending data for so that we could measure their performance against our ads. Each of the channels that you wish to measure has a different event name being sent to CAPI and need a separate custom conversion setup to capture the data within ads manager. Once they are setup you will be able to see the columns available under the custom conversions columns.
If you’re interested in capturing this type of data reach out to your Meta account team, your agency, or drop me a line at andrew@amjone.co and I’d be happy to help you get it setup. The Meta Conversions API Channel Lift Study Setup will help you get a better understanding of how your marketing ecosystem works! If you want to checkout tracking for new vs repeat customers within the pixel as well checkout my article here: https://amjones.co/meta-pixel-new-vs-repeat/
Meta Pixel - Measuring Customer Acquisition vs Repeat Customer Orders
How well are your targeting filters working on your Facebook ads? It can be quite hard to tell from standard pixel data what types of customers are seeing and purchasing from your ads. With iOS changes the ability for Facebook to properly filter out known customers has also declined. Ultimately, your older existing customer filters may not be working as well as you think. This means that your customer acquisition campaigns are not performing as well as you think.
Luckily if you are a Shopify customer you can easily send your Facebook pixel additional data context that will allow you to get a more granular view of performance. This can be especially helpful with “black box” campaign types like Advantage+ / ASC. In order to track customer types in platform you just need a simple Shopify script and Google Tag Manager with an imported template. Here is my guide to Facebook pixel new vs returning customer tracking.
Shopify Checkout Additional Script
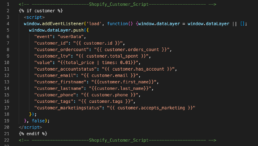
First add the following script to your checkout additional scripts in Shopify. The script will push some simple customer data into the dataLayer to send to your pixel. Make sure to place the script after your Google Tag Manager Script.
Download the script here:
Google Tag Manager Template
Next download the Google Tag Manager template and upload it to your Tag Manager container. Make sure when you upload it in the admin panel to set it to merge so you don’t overwrite any other items in GTM. Download the GTM template here:
Once you upload the template to GTM all of the variables will be preset for you. All you need to do is update your Facebook pixel ID. Your tag should look like this:
Now publish everything and you’re ready to start viewing the data in ads manager.
Ads Manager Data
Once the events have started sending data to the pixel you can view the performance of these custom events as attributed to your campaigns in ads manager. Here is an example of what the data looks like in ads manager. As you can see, campaigns that were set to exclude an email list of customers weren’t doing a great job of excluding existing customers. Despite the campaign having an existing customer exclusion this ASC campaign was driving almost 50% repeat customers. With some changes in the exclusion parameters it now drives 87% new customers with only 14% coming from existing customer profiles.
ASC New vs Repeat
As a note, this method only uses the web based pixel so if you are using a conversions API implementation you won’t see the new customer + repeat customer orders total add up to the campaigns total attributed purchases. This method won’t capture the additional sales attributed purely through CAPI. Use the ratio between new vs returning customers directionally in this case.
If you have any questions shoot me an email at andrew@amjones.co
or message me on linkedin at https://www.linkedin.com/in/amj45/
Thanks for checking out my guide for facebook pixel new vs returning customer tracking!

Shopify: Getting True New vs Returning, CAC, and CLV in Google Analytics
For years I listened to marketers tell clients things like “90% of your orders came from new visitors”; while the true % of orders attributable to new customers was actually far less. This reporting metric offers a very disingenuous view of customer acquisition. While a customer may be a “new visitor” by Google’s standard, many have actually been to the site numerous times before and even completed purchases. It’s 2022 and it’s time everyone did better.
Using Liquid to Send Shopify Data to Google
Shopify’s Liquid language offers even junior developers the ability to interact with data in Shopify and surface it within site pages to send to other platforms. With a few simple snippets we can pull customer level data from Shopify and send it to our analytics platform.
To get started with Liquid check out Shopify’s Cheat Sheet: https://www.shopify.com/partners/shopify-cheat-sheet
Variables Required
{% if %} – for control flow
{{ first_time_accessed }} – True if it’s the users first time accessing the page
{{ customer }} – The customer object which contains info about the user if they are a customer
{{ customer.id }} – The ID assigned to the customer by Shopify
{{ customer.orders_count }} – The historic order count attributed to the customer in Shopify
{{ customer.total_spent }} – The total monetary value of all orders the user has placed
The Script Setup
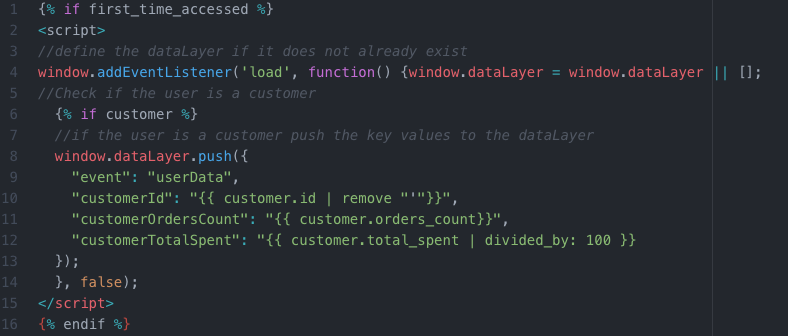
The script will first check whether this is the users first time accessing the page. This is important because we only want to fire our script on a users first time loading the page to prevent duplication in the analytics platform. Next, the script will check if the user is a customer. We are placing this scrip on the confirmation page of the site so this should always be true, but we do it just in case to prevent bad data capture. Finally, the script will send the customers ID, historic order count, and lifetime revenue value to the dataLayer for us to pickup and send to other platforms.
Here is the script:
Adding the Script to Shopify
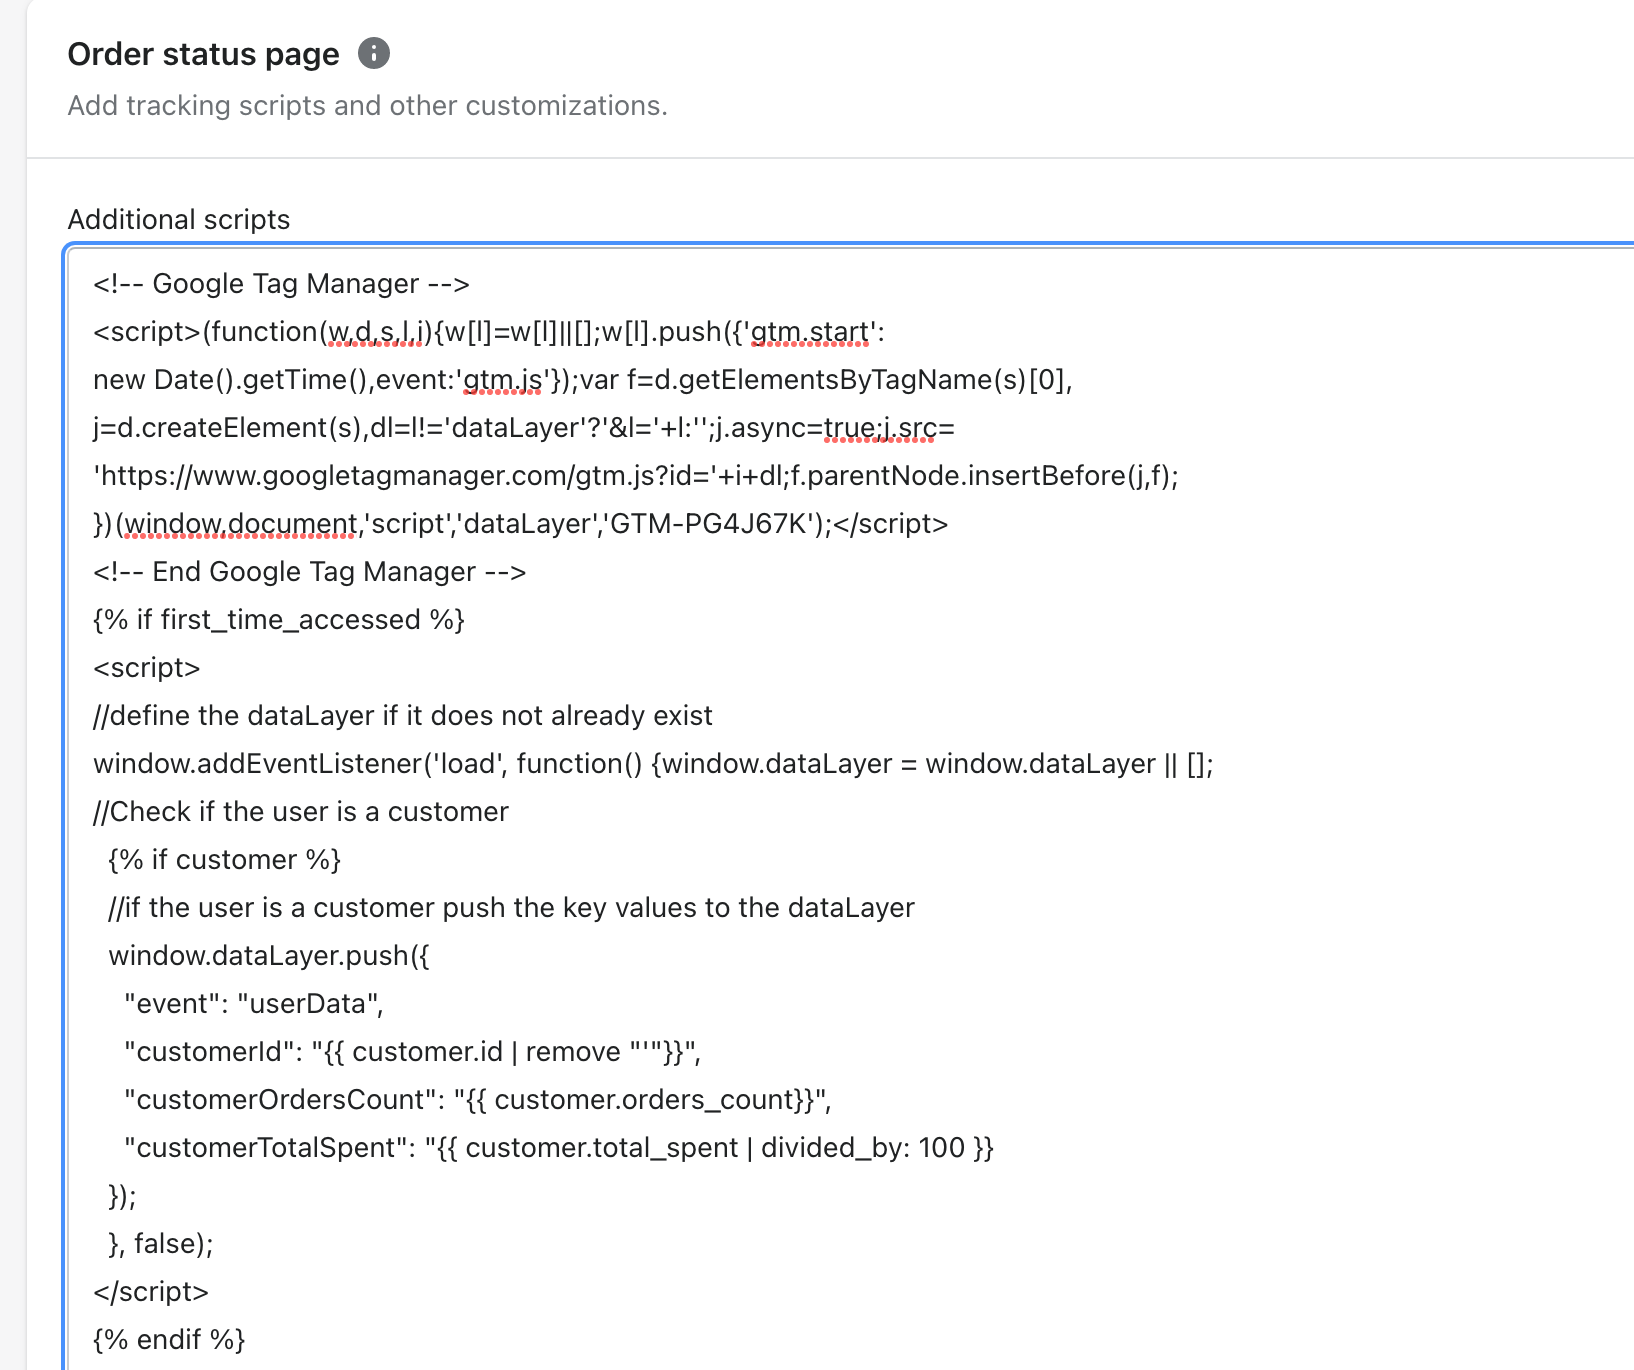
The script should be added to the additional scripts section of your Shopify store. You can find this under the store settings which live at the bottom of the left hand menu next to the gear icon. Under settings you will then select Checkout and then scroll down on the page until you find Additional Scripts under the Order status page section. You will then paste your snippet within this section.
You must also ensure that your Google Tag Manager snippet is added in this section as well. It should look like this when you are finished:
Capturing the Data in Google Tag Manager
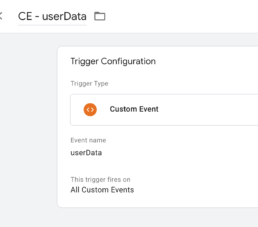
Within Google Tag Manager you will start with a trigger configuration that will fire tags based on the custom event that we have just sent to the dataLayer. The trigger should look like this:
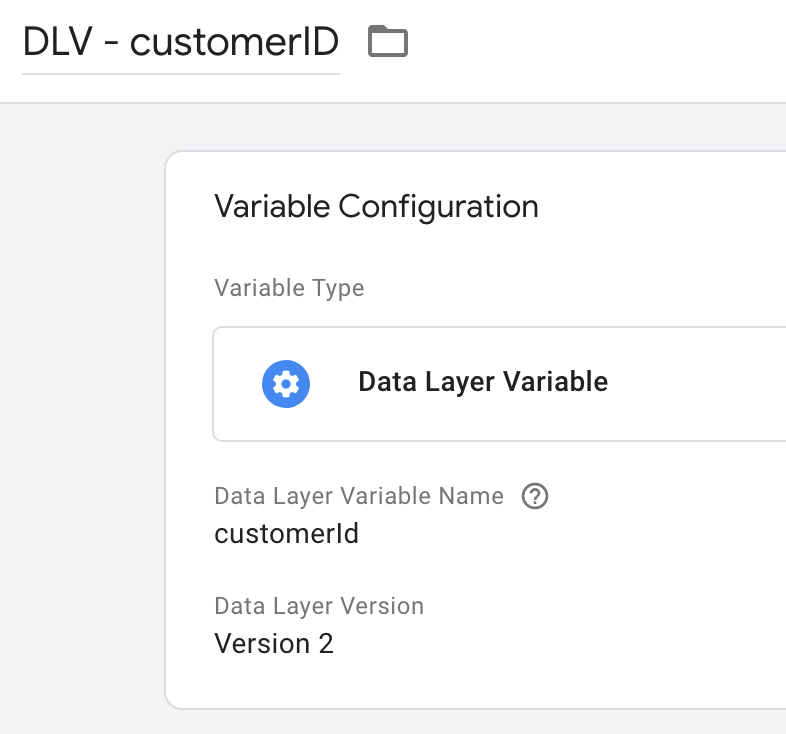
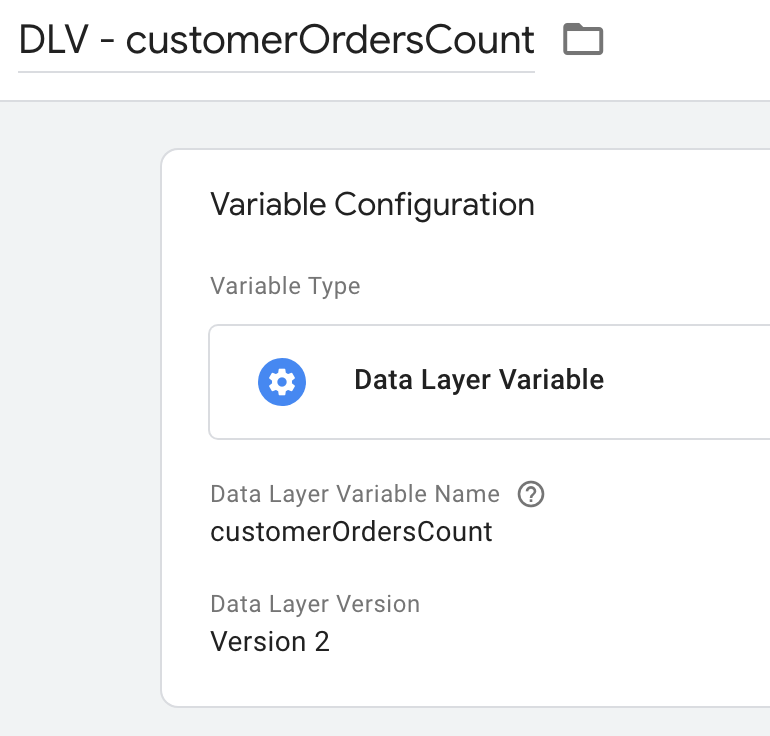
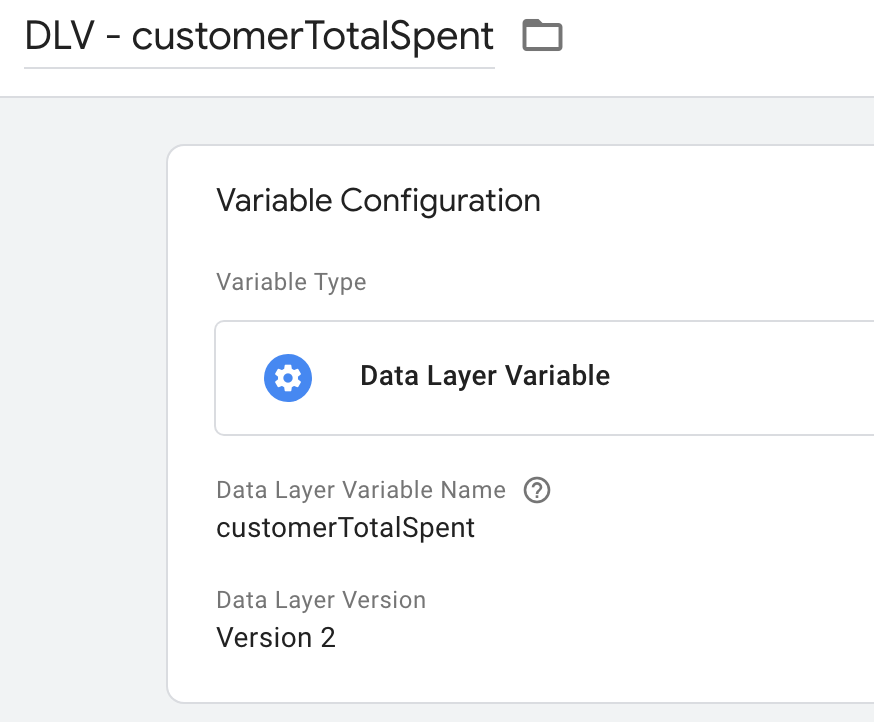
Next, you will create dataLayer variables for each of the Shopify data elements that we have sent to the dataLayer. The variables will look like this:
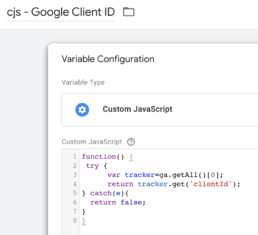
This is also a great time to add a variable that tracks the Google Client ID which will add an additional layer of tracking that helps with creating user journeys that lead to purchase. The client ID can be captured with this JavaScript variable:
These variables can now be utilized to send data via Google Tag Manager to any third party platforms.
Enhanced Downstream Reporting
This custom data capture allows you to do downstream reporting based on customer status, ID, journey, and CLV. Here are a few example reports with questions:
What percent of Paid Search Orders are new customers vs returning customers?
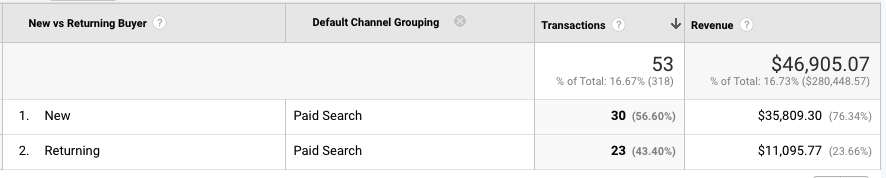
This can be further broken down by campaign, audience, and creative to show how specific campaigns contribute to customer acquisition vs. retention.
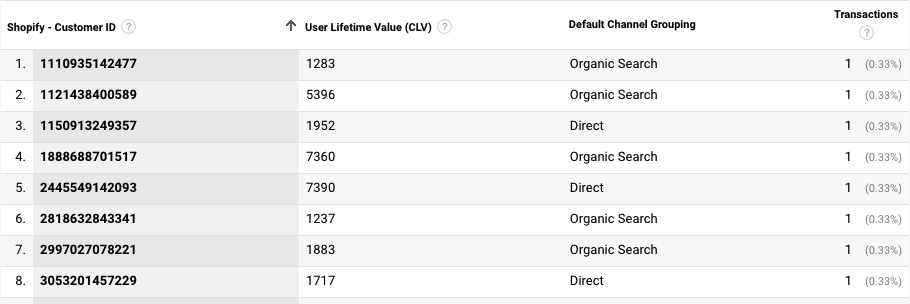
What is the Lifetime Value of the Customers purchasing on site and which channel drove them?
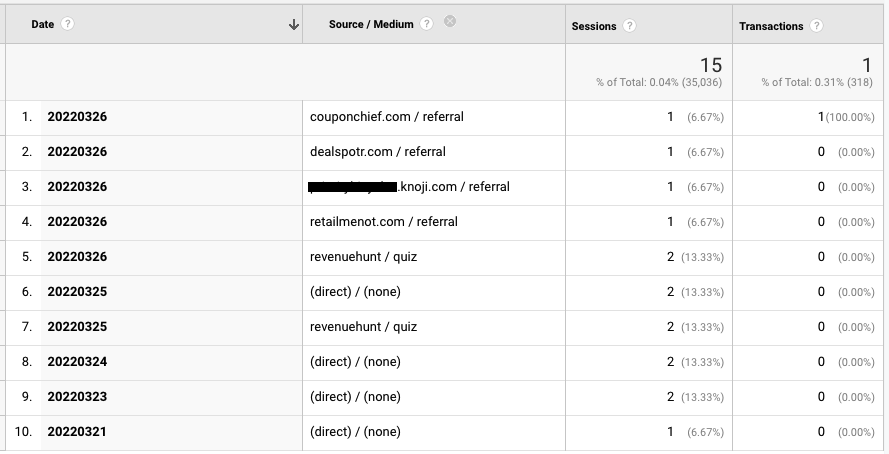
What Does the Path to Purchase Look Like for Customers?
Here is an example of a customer who visits the site 15 times over the course of a week while making their purchase decision. They start with a direct visit, but then search on reviews sites to find reviews on the product and ultimately purchase through a coupon site. Does the coupon site truly deserve credit for this order?
These data enhancements will allow you to get a much better view at the channels that are truly driving new customers for your business. This will allow you to get a much better channel by channel look at true customer acquisition costs. It also allows you to create your own attribution for orders based on the channels that a customer interacts with on their journey.
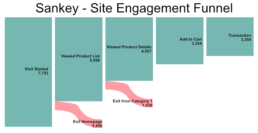
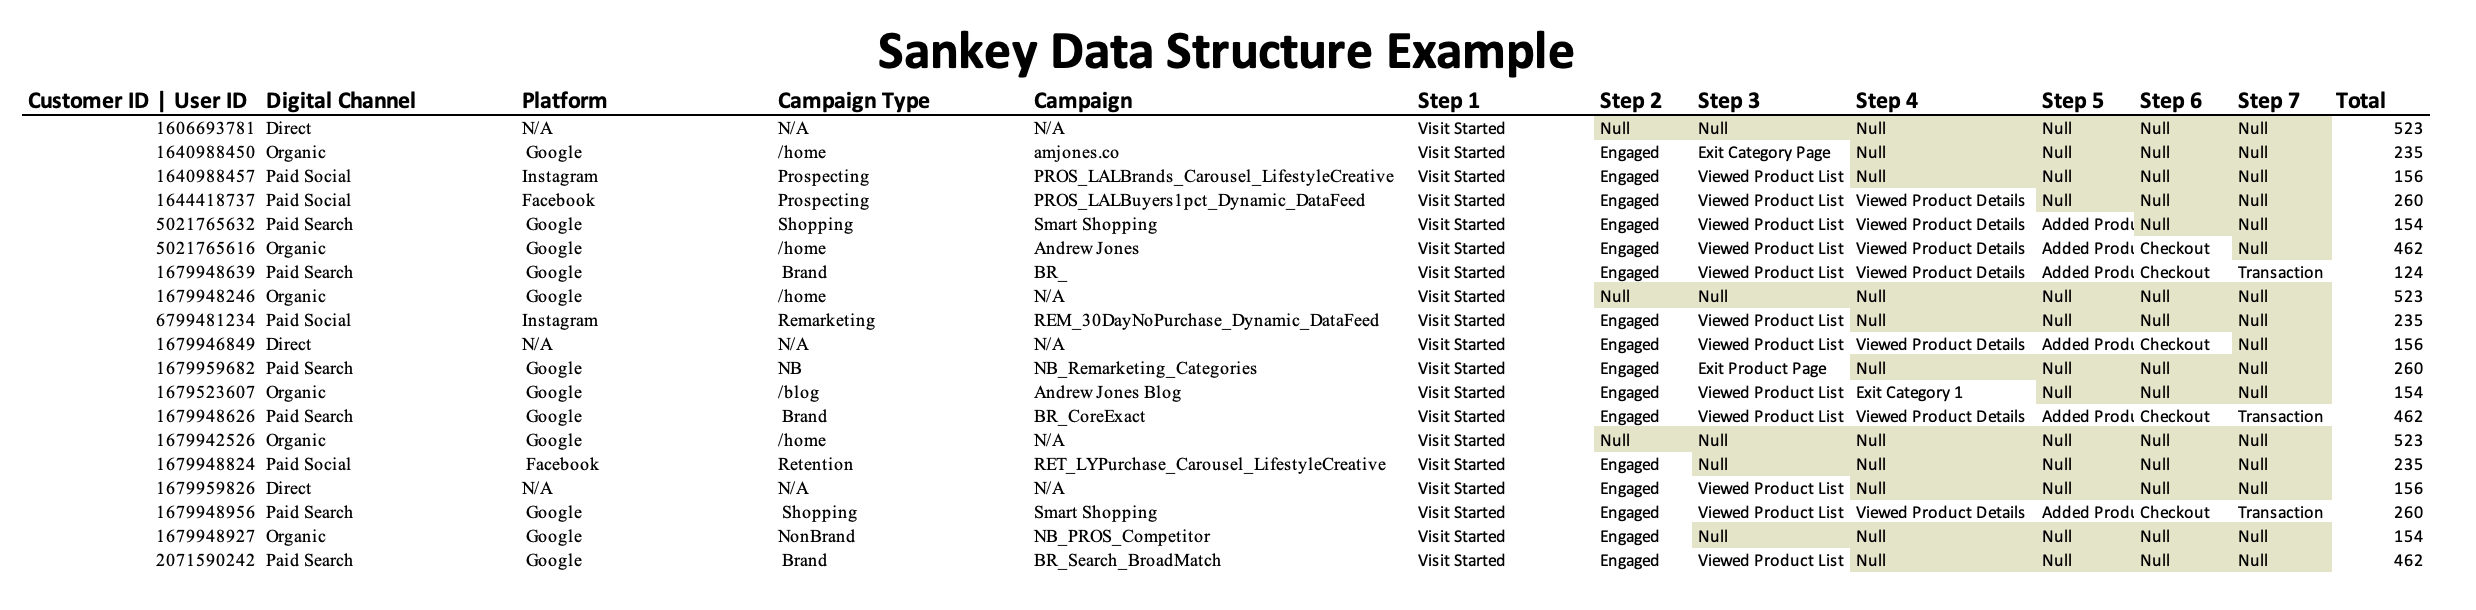
Visualizing Your Site Funnel With Sankey Charts
Sankey charts aren’t the most popular chart, but they are one of the best ways to visualize funnels and customer journeys. The hardest part about building Sankey charts is the data structure that is required to power them. You need to structure your data into steps based on user segments that cover all potential entrances and exits from your funnel. Capturing user IDs or customer IDs in your allows you to see the customer journey down to the individual customer level.
Clean data collection allows for nearly limitless sub segmentation based on user’s types, campaign types, platforms, audiences, creative, and more. The data is then structured into stages of the journey which then indicate whether the customer has completed a step and then either proceeded to the next step or exited.
The exits can be labeled based on sub segments as well. For example you could subset exits based on the category a user was viewing when they exited your product list page. This could show you which product lines are not resonating with customers or inversely which product lines have very low exit rates.
The sankey chart provides an extremely clean way to view your on site e-commerce funnel. It can show the rate at which users progress through the funnel as well as the areas of the site where there are the most exits. Adding data controls to the chart will allow you to show how the progression through the funnel varies based on marketing channel, audience, or creative exposure. It can also help you identify key segments to reengage in order to optimally drive conversion.
The one drawback to the sankey chart is the rather unique data structure that is required to power it. To create this data structure you must create user segments that show progression through individual portions of your defined funnel. Building this structure requires thought and data transformation skill so it is not ideal for novice Business Intelligence analysts. The output however is well worth the investment for an experienced analytics professional.
Google Analytics: Goodbye Universal Analytics, Hello GA4. What Comes Next?
Google Universal Analytics Is No More
The sunsetting of Google Analytics Universal Analytics in July 2023 will truly mark the end of an era in web analytics. When Google Analytics was first released in 2005 it was groundbreaking for businesses, developers, and marketers. It has remained a foundational piece of the web analytics toolkit for more than 15 years, persisting through massive changes in web technology. The announcement of the sunset of the Universal Analytics platform came as a shock to many in the analytics community.
What Does the Transition Mean for Users
Google would tell you that the transition to GA4 will be a simple, easy, and seamless process. The reality of the situation is much more complicated for many users. GA4 captures data in a different way than Universal Analytics so the tagging for it is new. The fields and interface that hold this data are different as well.
Updating Tagging Structure
The fact that GA4 tags capture data in a different way means that all of your existing tags will need to be rebuilt to support GA4. For each event that exists within Google Tag Manager you will need to build an additional tag tied to the same triggering to send data to GA4. GA4 also relies on a different dataLayer structure to capture e-commerce data. This means that users will either need to rebuild dataLayers on their sites or use Google Tag Manager’s custom JavaScript variables to reformat their data to support the GA4 structure.
See my GA4 e-commerce tagging GTM recipe here: https://amjones.co/ua-to-ga4-ecommerce-datalayer-gtm/
Updating Reporting
GA4 data capture is based off the firebase platform which means it’s optimized for collecting data from Mobile and Apps. It also means that the fields captured in reporting are more customizable. However, they don’t align with the existing fields captured in Universal Analytics. This means that reports that are currently powered by Google Analytics Universal Analytics connectors or data flows will need to be rebuilt using GA4 data.
Luckily Google has prepared a list of equivalencies between GA4 and Universal Analytics data: https://developers.google.com/analytics/devguides/migration/api/reporting-ua-to-ga4-dims-mets
This will help you recreate reporting, but it’s not a guarantee that the data will match UA exactly. Rebuilding reports with GA4 data sources will mean also that your data will not go as far back. You have until July 2022 to implement GA4 if you want year over year data. If you have a data ETL and storage process you may be able to stitch GA4 data with historical UA data to get a longer loopback window, but parity is not guaranteed.
Lack of Current Functionality
The new GA4 platform still lacks many of the critical functions that current Universal Analytics users have become accustom to using. Things as simple as allowing user control over features like custom channel groupings and filters are currently missing from the administrative toolset. Instead users must set their filters via variables which leaves the IP, domain, and other matching to the end user in their tag manager. Setting custom utms for channel groupings is crucial for classifying campaigns from outside platforms.
GA4 also lacks the ability to map custom dimensions which are key for many users, particularly GA360 customers. Many GA360 customers have 50 or more custom dimensions that they use for advanced reporting. The expansion of the available customizations is one of the things that makes GA360 great, so to have them missing from GA4 makes implementation much more complicated. Google has the addition of custom dimensions on their roadmap, but the fact that they are missing at the time of the transition announcement is a huge miss.
Benefits of GA4
Although GA4 doesn’t seem fully ready for prime time and will require significant effort to setup, that doesn’t mean that it doesn’t improve on Universal Analytics. GA4 configurations are wired in with what Google calls “Advanced Measurement” which integrates page view, scroll, outbound click, site search, video engagement, and file download tracking into the platform by default. The platform switch will also likely bring Google more in line with personal data laws like GDPR and CCPA which is likely why the transition came quickly after the French court ruling outlawing Google Analytics.
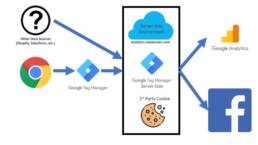
Server Side Tagging via GTM - The Future of Analytics
Existing web analytics client side implementations through standard Google Tag Manager containers rely on a browser based tagging solution to add tags to the website and send data to third party platforms. This has historically worked great for sending data to ad serving platforms, but with the addition of Apple’s ITP and browser limitations on third party data collection there are now downsides to client side tagging.
For example, if a user visits your website from an Apple device then the cookie placed on their browser by Facebook, Google, and others to identify to identify them will be deleted within 24 hours. This means that if I come back to the site the next day your third party platforms will view you as a different user. This is why you oftentimes see Google Analytics “New User” percentages well above 90%.
Server side tagging is what will enable marketers and analytics teams to implement future state tracking capabilities like the Facebook conversions api (CAPI).
Client Side Tagging
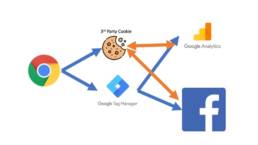
Client side tagging solutions like traditional GTM containers place tags that send data to third party platforms on the website. All of the data collection in this context happens on the “client-side” (within the browser). This means that the cookies that are placed by your third party platforms like Facebook are viewed as third party cookies. In this context Facebook places a cookie which has a source of facebook.com which does not match your domain and is therefore 3rd party.
This also means that your data collection is victim to users who block on site scripting via adblock or disabled javascript and errors with data payloads. For example, ~15% of all ecommerce purchases are missed within Google Analytics due to some combination of possible errors with client side tagging.
Server Side Tagging
Server Side Tagging solves for these problems by sending data through a tagging server hosted on your domain (think analytics.yourdomain.com). Data from cookies placed by third parties like Facebook can be read from the browser by your tagging server and then stored in a 1st party context (where the domain on the tagging server matches the domain of your website). This means that data for a single user can be stored on the tagging server far beyond the 24 hours that cookies last when using an Apple device or browser that limits cookies.
The use of server side tagging also allows for the connection of other third party data streams that can solve for missing data. For example, you can connect your tagging server via Google Tag Managers Server Side container to services like Shopify’s Webhook. This means that transactional data is delivered directly from Shopify’s APIs to your tagging server resulting in no loss of conversion data. You can immediately begin collecting the 15% of orders that were being lost in your client side tagging setup.
Downsides to Server Side Tagging
There are a few downsides to server side tagging setups in their current state. Tools like Google Tag Manager’s Server Side container are still in beta and do not have support for connections to many third party services. That means that if you want to deploy a server side container today you will need to develop your own connections to your third party platforms or rely solely on the data from your existing client side container.
One of the other downsides to server side containers is that because they are hosted on a subdomain of your existing website there are hosting and data transfer costs associated with them. I have personally hosted tagging servers within Google Cloud Platform and the costs to do so is often marginal, but there is additional IT support and the cost is greater than the free client side data transfers.
The Future of Tagging
When they deployed the server side option for Google Tag Manager Google indicated that they believe there is a future for tagging in a server side environment. The use of server side tagging solves for many of the pain points of client side tagging. As with all new technologies there is a learning curve to deploying server side tagging which will no doubt decrease as GTM’s server side container comes out of beta and begins to support integrations with other third party platforms.
For more information on server side tagging via Google Tag Manager take a look at these resources:
Provisioning Server:
https://developers.google.com/tag-platform/tag-manager/server-side
Sending Data to Tagging Server:
https://developers.google.com/tag-platform/tag-manager/server-side/send-data
Building a Server Tag:
https://developers.google.com/tag-platform/tag-manager/server-side/how-to-build-a-server-tag
Server Side Tagging Overview from the king himself Simo Ahava:
https://www.simoahava.com/analytics/server-side-tagging-google-tag-manager/
Repurposing Your Universal Analytics dataLayer for GA4 with Google Tag Manager
Buildout Your GA4 Ecommerce Data Collection via GTM Using Your Existing UA Implementation
The introduction of Google Analytics 4 brought with it a new dataLayer structure required to send e-commerce data to Google Analytics. The new requirements for implementing GA4 have been a major roadblock for implementation. Updating ecommerce dataLayers often require development resources that are typically expensive and busy.
By using Google Tag Manager you can easily restructure your existing ecommerce dataLayer that is built for Google Analytics Universal Analytics events into a data structure that works for GA4. For reference on the requirements differences between GA UA and GA4 review Google’s documentation:
GA UA dataLayer Requirements:
https://developers.google.com/analytics/devguides/collection/ua/gtm/enhanced-ecommerce
GA4 dataLayer Requirements:
https://developers.google.com/analytics/devguides/collection/ga4/ecommerce
Using custom javascript variables within Google Tag Manager you can easily repurpose your existing GA UA dataLayer to send data to GA4. Here is an example of a code snippet that can be used to update your formatting for an enhanced ecommerce add to cart event:
function() {
// use variable for add to cart array ecommerce.add.products
var products = {{dlv – ecommerce.add.products}};
return products.map(function(product) {
return {
“item_id”: product.id,
“item_name”: product.name,
“item_list_name”: product.list,
“item_list_id”: product.list,
“item_brand”: product.brand,
“item_category”: product.category,
“item_variant”: product.variant,
“quantity”: product.quantity,
“price”: product.price
}
});
}
The code snippet above uses the map function within javaScript to send attributes from the existing product dataLayer to the correct elements structured based on Google’s documentation. You would input this code in a custom javascript variable. This variable can now be input in a GA4 tag in place of where the dataLayer variable typically goes.
In order to add custom dimensions to this structure you can simply map them using key value pairs. These look like:
k0: “customDimension1”,
v0: ‘CD1 value’
Downloadable JSON file that contains the GTM snippets for all e-commerce events (you will need to have your own triggers): https://amjones.co/wp-content/uploads/2022/01/UAtoGA4EcommerceTags.json
Here are examples of other Ecommerce custom javascript variables for other parts of the funnel:
Product Impression (view item list):
function() {
// variable for ecommerce impressions ecommerce.impressions
var impressions = {{dlv – ecommerce.impressions}};
return impressions.map(function(impression) {
return {
“item_id”: impression.id,
“index”: impression.position,
“item_list_name”: impression.list,
“item_list_id”: impression.list,
“item_name”: impression.name,
“item_brand”: impression.brand,
“item_category”: impression.category,
“price”: impression.price
}
});
}
Product Click (select item):
function() {
// product click dataLayer variable
var products = {{dlv – ecommerce.click.products}};
return products.map(function(product) {
return {
“item_id”: product.id,
“index”: product.position,
“item_list_name”: product.list,
“item_list_id”: product.list,
“item_name”: product.name,
“item_brand”: product.brand,
“item_category”: product.category,
“price”: product.price
}
});
}
Product Detail View (view item):
function() {
// product detail view dataLayer ecommerce.detail.products
var products = {{dlv – ecommerce.detail.products}};
return products.map(function(product) {
return {
“item_id”: product.id,
“item_name”: product.name,
“item_list_name”: product.list,
“item_list_id”: product.list,
“item_brand”: product.brand,
“item_category”: product.category,
“item_variant”: product.variant,
“price”: product.price
}
});
}
Checkout:
function() {
// dataLayer variable for checkout products ecommerce.checkout.products
var products = {{dlv – ecommerce.checkout.products}};
return products.map(function(product) {
return {
“item_id”: product.id,
“item_name”: product.name,
“item_list_name”: product.list,
“item_list_id”: product.list,
“item_brand”: product.brand,
“item_category”: product.category,
“item_variant”: product.variant,
“quantity”: product.quantity,
“price”: product.price
}
});
}
Purchase:
function() {
//variable with product data for purchase ecommerce.purchase.products
var products = {{dlv – ecommerce.purchase.products}};
return products.map(function(product) {
return {
“item_id”: product.id,
“item_name”: product.name,
“item_list_name”: product.list,
“item_list_id”: product.list,
“item_brand”: product.brand,
“item_category”: product.category,
“item_variant”: product.variant,
“quantity”: product.quantity,
“price”: product.price
}
});
}
This is a Test Title
Test bullet points and headers
Key Reports to Use
Analytics Customizations and How They Can Enable Multi-Touch Attribution and User Journey Analysis
- Mapping unique user identifiers for Online Traffic and media impressions
- Hashed Email Address (from email list, customer file, on site form interactions, etc.)
- Attribute information in the customer file to website visits and marketing impressions
- User ID # from web visits
- Capture a unique user ID that persists across sessions to identify user journey steps and answer business questions. How did they first come to the site? How often do they visit? Through what channels are they brought back to the site? How do their site engagements evolve over time?
- Hashed Email Address (from email list, customer file, on site form interactions, etc.)
Audience Reports
Traffic Reports
- Test
Ecommerce Reports
- a